Showing posts with label retail electricity. Show all posts

September 30, 2019

太陽光発電、導入量米国No.1! カリフォルニア州の注目制度、CSIとは

Published at Solar Journa
カリフォルニア州で住宅用太陽光発電市場が大きく変わろうとしている。2020年の1月1日以降に建設される全ての住宅に、太陽光発電を設置することが義務化されるのだ。ゼロ・ネット・エネルギーホームへの挑戦が始まる。

導入量米国No.1
カリフォルニア州の政策

カリフォルニア州は、米国の太陽光発電導入量において突出している。2019年の第1四半期末時点で、累計の太陽光発電導入量は25GW超えを記録。なかでも、屋根置き住宅用システムを含む分散型太陽光発電の導入量は8GWを超える。同州は、他州や連邦政府に先行し、太陽光発電普及政策を施行してきた。
過去、最も注目を集めた制度は、2006年に施行された「カリフォルニア・ソーラー・イニシアチブ(CSI)」と呼ばれる太陽光発電補助金プログラムで、2016年までに1.9GWの太陽光発電システム導入を目標とした。この補助金プログラムの画期的なポイントは、電力需要が上がるにつれて補助金額が段階的に下がるところだ。
これによって電力消費者の補助金負担額が最小限になり、予算は効率的に使用される。このようなシステムを取り入れたのは、このプログラムの趣旨が「(2016年までに)太陽光発電産業を補助金に頼らない産業に育てる」ことだったからだ。

「卒・補助金」へ
カリフォルニアの次の一手

昨年、カリフォルニア建物基準委員会(CBSC)は、2020年1月より新築住宅に太陽光発電導入を義務付ける新しい規制を承認した。この新築住宅への太陽光発電設置義務は、全米初となる政策だ。
カリフォルニア・ソーラー・ストレージ協会(CALSSA)によると、現在のカリフォルニア州では、年間に約150000もの新築・既存住宅に太陽光発電が設置され、そのうち新築住宅に設置されるのは約10%の15000件だ。同州では年間平均80000の新築住宅が建てられるので、2020年以降に建設される全ての住宅に太陽光発電が設置されると、市場が現在の5倍以上に拡大することとなる。
カリフォルニア州は、環境保護政策や気候変動対策において、米国だけでなく世界をリードしている。同州は温室効果ガスの排出量を2020年までに1990年の水準まで削減し、さらに2050年までにその80%を削減するという高い目標を掲げ、全米初の排出量削減を法制化した州となった。
さらに、新築住宅用建物は2020年まで、そして新築商業用建物は2030年までにゼロ・ネット・エネルギー(ZNE)にするという目標を2008年に成立させた。「ZNE」とは、住宅を含む建築物の断熱性・省エネ機能を改善させ、太陽光発電などでエネルギーを創ることで、年間の消費エネルギー量(冷暖房・給湯・照明など)の収支をプラスマイナス「ゼロ」にすることである
また同州では、建築物における電力、天然ガスなどのエネルギー消費の削減を促すために、「タイトル24」と呼ばれるエネルギー効率(省エネ)基準が導入されている。建物省エネ基準は3年ごとに調整・更新され、今回の新築住宅に対する太陽光発電導入義務は「2019年建築物省エネ基準」に含まれた。今回の基準は同州のZNE目標を達成するための「手段」の1つになるといわれている。
具体的には、太陽光発電の設置の他に、住宅の壁や窓などの断熱性能の向上、高効率の省エネ設備機器の搭載など、様々な省エネ化の基準が含まれている。さらに、新築住宅が高い建物の陰になっているなど、太陽光発電設置に適切でない場合における柔軟な対応法なども含まれている。その1つが蓄電池の併設である。

May 28, 2018

米ラスベガスの巨大ホテル、メガソーラーで電力需要の3割を賄う! 屋根置き太陽光を自家発電、電力会社から離脱、そして「100MW」・・・

Published at Nikkei Technology ---

ネバダ州最大の電力需要家

 広大なテーマパーク、米ネバダ州のラスベガス。大きな人造湖での噴水ショーが有名な「ベラージオ」、古代エジプト・ピラミッドの形の「ルクソール」、滝のある南国リゾートのような「ミラージュ」、本当のニューヨークのような「ニューヨーク・ニューヨーク」――。これらのホテル・カジノは、社名と同名のホテル・カジノで知られているMGMリゾートが運営する。
 実際、MGMリゾートはラスベガスに計13のホテル・カジノを持っている。それゆえに同社は、ラスベガスのみならず、ネバダ州最大の電力需要家となっている。
 そこで同社は、これらのホテル・カジノの電力供給をグリーンエネルギーで賄うため、ラスベガス付近に建設される出力100MWのメガソーラー(大規模太陽光発電所)から電力を購入すると、今年4月に発表した(図1)。
図1●MGMリゾートがラスベガスで運営するホテル・カジノの一つ「ニューヨーク・ニューヨーク」
(出所:MGM Resorts International)

 MGMリゾートは、10年前以上に「コーポレート・サステイナビリティ事業部」を設けて、2014年には、同社運営のマンダレイベイ・ホテル&カジノのコンベンションセンター屋上にパネル容量6.4MWのメガソーラーを設置した。当時このサイズは世界で最大規模の屋根置き(ルーフトップ)システムと注目を集めた。さらに約2MWを付け加え、合計出力8.3MWとなり、マンダレイベイ・ホテル&カジノの電力需要の25%を供給している。... Read More Here

April 30, 2017

米加州の住宅太陽光のコストが下がりにくい理由 発電量よりも電気料金の水準が導入費用に影響

Published at Nikkei Technology Online --- 太陽光発電導入コストが3.36ドル/Wに低下

 米エネルギーセイジ(EnergySage)社の最新のレポートによると、太陽光発電システムの全米平均導入コストは、2016年後期(7~12月)の3.36ドル/Wで前期(1月から6月)から6.25%も下がった。

 この削減率は、ここ数年で一番大きかったという(図1)。この価格の低下は、顧客獲得コストの低下、市場競争の高まり、そして太陽光発電の設備コストの低下などが反映されている。

図1●米国における半期別太陽光発電システム導入コスト(米ドル/W)
(出所:EnergySage)

 エネルギーセイジ社は、太陽光発電システムに興味を持つ住宅所有者に複数の業者から見積もりを取れる便利なオンラインマーケットを提供する 。 同社のサイトには、厳しい審査基準をクリアした、高い実績・評判を持つ地域の販売・設置事業者350社以上が参加している。しかし、米住宅太陽光市場において全国規模でビジネスを展開しているテスラ社に昨年末買収されたソーラーシティ社やサンラン社などは参加していない。

導入コストは州によって大きな差

 エネルギーセイジ社は半年毎に、収集した見積もりデータを分析し、「ソーラー・マーケットプレイス インテリ・レポート」として発表している。このレポートで興味深い点は、全米のみならず、州別の導入コストのデータが含まれていることだ。今回のレポートに含まれている州は、アリゾナ、カリフォルニア、フロリダ、イリノイ、メリーランド、マサチューセッツ、ニューヨーク、オハイオ、テキサス、バージニアの全10州となる。

 どの州でも前期から後期にかけて平均導入コストは低下したが、特に低下の大きかった州はバージニアだ。後期の導入コストは前期から14%減の3.02ドル/Wだった(図2)。ちなみに、同州の2016年における太陽光発電の導入量は192MWで、全米で17番目だった。しかし、導入量の大部分は、電力発電事業用の大規模太陽光発電所であった。

 アリゾナ州の平均導入コストは、2.97ドル/Wとなり、3ドル/Wを切った。同州の2016年における太陽光発電導入量は656MWで、全米で7位番目だった。導入量の約3分の1は住宅用システムが占め、同州の住宅太陽光市場(累積)はカリフォルニア州に続き、全米で2番目に位置する。

 低コスト化が進んでいるのは、住宅用システムに導入量、または普及率の高さを反映しているとも考えられる。...Read More Here

April 26, 2017

California is the biggest PV market, but not the cheapest... What influences price differences among states?

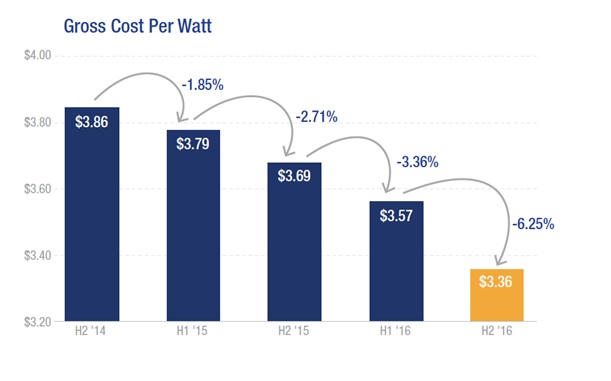
EnergySage published a new report “Solar Marketplace Intel Report,” which compared the residential PV market data in the second half of 2016 with the first half of the same year. Based on quotes EnergySage collected from market place users across 34 states and Washington DC, it revealed that the average national gross cost in H2’16 declined by 6.25% from H1’16 to $3.36.

Of the findings presented, one of particular interest is the difference in system costs among the 10 states (Arizona, California, Florida, Illinois, Maryland, Massachusetts, New York, Ohio, Texas and Virginia) EnergySage selected for this report.  Looking at data in H2’16, Arizona has the lowest gross cost of $2.97/W, followed by $3.01/W in Ohio and $3.02/W in Virginia.  According to the Solar Energy Industry Association, in 2016 Arizona installed 656 MW of PV, of which one thirds was for residential installations. In fact, Arizona is the second largest residential PV market. Does the low cost reflect the size of the market?

Chart: Residential PV System Cost: 1H’16 vs. 2H’16

Looking closer at the data, you will notice that California has the third highest PV system cost at $3.38, after New York with $3.59/W and Massachusetts with $3.57/W.

How does California, the biggest PV market in the U.S., have one of the highest gross costs? Isn’t this the assumption: “the more PV is installed; the cheaper installation costs become”?

A large market size does not necessarily bring down the cost

The chart below shows (1) residential PV installed system cost ($/W) in H2’16 and (2) net-metered residential PV capacity at the end of 2016 (data source: EIA).

Chart: H2’16 Residential PV System Cost and Net-Metered Residential PV Capacity (as of December 2016)

California’s residential market is about 5 times as big as that of Arizona and the cost in California is 15% higher than Arizona.  Similarly, California’s residential market is about 153 times as big as Virginia, but the cost in California is 12% higher than Virginia. One would expect the market size to influence the installation costs more consistently.

Let’s check the relationship (the correlation) between (1) installed cost and (2) market size. The correlation coefficient between gross cost per watt and net-metered PV capacity is 0.32. This correlation value indicates a relatively weak positive relationship between those two variables. That means, for example, in California, the largest PV market, PV installation costs are not necessarily the cheapest.

Economies of Scale, does the size matter?

Normally, as the system size gets bigger, the cost per watt goes down.  That’s why utility-scaled solar plants or non-residential PV systems are much cheaper than residential in terms of dollar per watt.

According to EenrgySage’s data, the average system size in H2’16 in Florida is 12 kW, over 70% bigger than that of California (7 kW) while the gross cost in Florida is just 10% lower than that of California.  The correlation coefficient between gross cost per watt and average system size is -0.53, indicating a not-so-strong negative relationship between these two variables. It means that a larger system doesn’t necessarily lower the dollars per watt.

Chart: H2’16 Residential PV System Cost and H2’16 Average System Size


Electricity is the biggest influencer

Because utility electricity rates have a major impact on PV economics (payback time and investment return), let’s check whether electricity rates influence the system cost. The chart below shows (1) the residential PV installed system cost ($/W) in H2’16 and (2) the 2016 average residential electricity price ($/kWh) (data source: EIA).

The correlation coefficient between gross cost per watt and electricity price is 0.88, indicating a strong positive relationship between these two variables. The higher the electricity price, the higher the system cost and the lower the electricity price, the lower the system cost.

Chart: H2’16 Residential PV System Cost and 2016 Average Residential Electricity Price


Both Massachusetts ($0.19/kWh) and New York ($0.18/kWh) have the highest electricity price as well as the highest system cost. The average residential electricity price in California was $0.17/kWh. Compared to Virginia, the electricity price was 52% higher and the gross system cost was 12% higher.

Considering that component costs (solar modules, inverters and mountings) are relatively similar across the states, let’s check with an important part of the soft costs – installation labor.

By using labor data collected by U.S. Bureau of Labor Statistics, the chart below shows (1) residential PV installed system cost ($/W) in H2’16 and (2) Electricians’ (47-2111) hourly mean wage in May 2016 (data source: U.S. Bureau of Labor Statistics). The correlation coefficient between gross cost per watt and electricians’ mean hourly wage is 0.83; similar to the one with electricity price, indicating a strong positive relationship between these two variables. For example, New York has the highest electricians’ hourly mean wage as well as the highest gross cost.  Virginia has the third lowest electricians’ hourly mean wage as well as the third lowest gross cost. 

Chart: H2’16 Residential PV System Cost and Electricians’ Hourly Mean Wage (as of May 2016)


Looking at statewide incentive programs (excluding programs run by municipals), out of the 10 states, only Maryland and New York offer rebate programs (Maryland Residential Clean Energy Grant Program, The NY-Sun Incentive Program, respectively). Four states (Ilinois, Maryland, Massachusetts and Ohio) have active SREC markets toward the state RPS carve-out.  Arizona, Massachusetts and New York offer personal tax credits.

Statewide Incentive Comparison

Personal Tax Credit
SREC Trading
(2016 Average)
Rebate
Arizona
25% (up to $1000)


Illinois

~$168/MWh

Maryland

~$167.5/MWh
$1000/per system
Massachusetts
15% (up to $1000)
~$285/MWh

New York
25% (up to $5000)

$0.40/W (step 7)
Ohio

~$15/MWh


To sum up what influences price differences among states, Nick Liberati, Communication Manager at EnergySage stated as follow:

“As far as why certain states are higher, it's most likely a result of electricity prices and the availability of incentives. MA and NY have strong incentive programs and high electricity rates, while other states (e.g., Florida, Virginia) have lower electricity rates. This means installers in these states have to price their products lower in order to be competitive, even if it means that they take a lower margin.”

August 1, 2016

分散型太陽光の拡大で「消費者が力をつける」時代に (北米「インターソーラー2016」レポート(後編))

Published at Nikkei Technology Online --- 今年で9年目を迎える太陽光発電関連で北米最大規模の総合イベント「Intersolar North America(北米インターソーラー)」(2016年7月11~13日)が、米国カリフォルニア州サンフランシスコで開催された。
 今回のイベントでは、これからの太陽光発電と蓄電池を含む分散型電源(Distributed Energy Resources:DER)の導入拡大とグリッド(送配電網)との統合などに関する話題が多くの講演で取り上げられた。

電力の消費者がアクティブな役割を果たす

 米国の住宅用太陽光発電市場でリーディングカンパニーである米Sunrun社の創業者兼最高経営責任者(CEO) Lynn Jurich氏が、イベントのオープニングセレモニーで基調講演を行った。米Sunrun社は、住宅用のみに特化したターンキープロバイダーで、累計30億米ドル以上の住宅用太陽光発電システムを全米15州で売り上げた。リースなどのファイナンスを含めて提供している。
 Jurich氏は、「パワーセクター:電力消費者が力をつける時代」と題し、分散型電源のグリッドにおける利点について講演した。これは電力の消費者(需要家)が電力会社から電気を購入するだけの一方通行で受動的な立場から、太陽光発電、蓄電池などの分散型電源を利用して、発電や売電などもっとアクティブな役割を電力市場で果たすことを意味する。
 「消費者が自ら『決定する力を持つ』時代が到来しました。消費者は自分が購入する、または選択するサービスに対してコントロールを欲するようになり、ビジネスセクターは消費者のニーズを理解しない限り、顧客を獲得できません」と、Jurich氏は語った(図1)。
図1●北米インターソーラーのオープニングセレモニーで基調講演を行う
米Sunrun社の創業者兼最高経営責任者(CEO) Lynn Zurich氏
(出所:Solar Promotion International GmbH・July 2016)

将来膨れ上がる電力インフラへの総投資コスト


次にJurich氏は、将来膨れ上がる電力インフラへの総投資コストについて話した。米国研究機関The Brattle Groupによると、1989~2009年の20年間における電力インフラ(発電、送・配電網)に対する投資は5230億米ドルであった。これに続く20年間(2010~2030年)には、なんと約3倍の1兆5000億米ドルに膨れ上がると予想されている...Read More Here

July 19, 2016

アメリカで電力小売り自由化が人気!

Published at Solar Journal:
日本では今年4月に電力小売り全面自由化が始まったが、米国では1990年代に自由化が始まっている。開始して20年程が経つ米国では、どのようなサービスが登場し、消費者はいかに電力会社を選択しているのか。米国の現在の様子から、日本の市場の行方を見る。

州レベルで電力自由化が実施される米国

現在50州中14州およびワシントンDCで電力小売の全面自由化を実施中である。電力の規制が国レベルではなく州レベルで可決される米国では、自由化をしている州もあれば、しない州、さらにカリフォルニア州のように自由化を試みたが失敗し、自由化が「保留」になっている州も存在する。
小売り自由化されている市場で最も規模が大きいのはテキサス州で、次いでオハイオ州、ニューヨーク州、ペンシルベニア州など東海岸の州がトップを占める。

太陽光100%の電力プランで地域貢献

テキサス州オースティン市に拠点を持つGreen Mountain Energy 社は、1977年より再生可能エネルギーの小売販売を始めた。
同社は現在自由化を実施しているテキサス、ペンシルベニア、ニューヨークを含む7州で電力小売り販売を行っている。
同社が提供する電力プランの中で最も人気を博しているのが、太陽光発電で作った電気だけを買うことができる、「SolarSPARC(ソーラースパーク)」というプランだ。契約者が家庭の電力消費を太陽光発電の電力で1%賄えるだけではなく、地域への太陽光発電設置の導入も促進する。
Green Mountain Energy 社はSolarSPARC の契約数ごとに、毎月4米ドルを寄付して積み立てており、その寄付金で6ヶ月ごとに、新しい太陽光発電施設を地域に設置する計画になっている。
つまり、契約者が多ければ、より多くの、またはより大きな太陽光発電施設を設置できるというわけだ。...Read More Here

July 14, 2016

分散型太陽光発電の大量導入が引き起こす「デス・スパイラル」、「ネットメータリング」改正を巡る論争の焦点に

Published at Nikkei Technology Online ---  米国では、太陽電池などのコスト低下、第3者所有者モデルを含むイノベーティブなファイナンシングオプションの普及、さらに、再生可能エネルギーの導入政策の進展により、住宅用などの分散型太陽光発電システムの導入が加速した。

 導入政策の1つが「ネットメータリング制度」で、太陽光の発電分を電力購入単価と同額で相殺し、電気料金を削減できる州レベルの制度である。この経済効果は大きく、太陽光の普及促進に重要な役割を果たしてきた。しかし、普及が進むにつれ、電気料金支払い時に生じる「経済的不公平」への懸念が、ここ数年、米国で議論されている。

ネットメータリングが生む「不公平」


 「経済的不公平」は以下のように生じる。自産自消を促進する分散型太陽光発電システムの導入が増えるにつれ、電力会社の販売する電力の総量は減っていく。電力を利用した量ごとにチャージする「電力量料金(従量料金)」収入が減る。

 ゆえに、電力量料金の一部である送配電網のメンテナンスなどを含む固定費を回収するベースが小さくなる。そこで、固定費を回収するため、電力会社が電気料金の値上げに踏み切った場合、太陽光発電を所有しない電力需要家の負担が相対的に大きくなる、というものだ。

 このような懸念から、ネットメータリング制度の改正と電気料金制度の変更が、電力会社と太陽光発電産業の間で大きな論点となっている。固定費回収のための値上げ、またはネットメータリングの買取価格を小売り同等ではなく、需要と供給に合わせた時間帯別単価を適応する、というものである。

固定費回収が引き起こす「デス・スパイラル」


 これら二つの料金制度はどのように今後の太陽光発電導入に影響するのか?

 この論点をカリフォルニア州サンフランシスコに拠点を置く米ローレンスバークレー国立研究所(LBNL:Lawrence Berkeley National Laboratory)が定量分析で検証した。その結果は昨年、「ネットメータリングと市場フィードバックのループ:電気料金制度改正が与える分散型太陽光発電導入への影響の検討(Net Metering and Market Feedback Loops:Exploring the Impact of Retail Rate Design on Distributed PV Deployment)」と題したレポートに発表された。...Read More Here

June 14, 2016

米陸軍、基地内のメガソーラーで、エネルギー安全保障を強化 民間企業と連携し、再エネ主体のマイクログリッド構築

Published at Nikkei Technology Online ---  今年6月初め、米国ジョージア州西部にある米軍最大の歩兵部隊駐屯地フォートベニング(Fort Benning)基地に連系出力30MW(パネル容量42MW)のメガソーラー(大規模太陽光発電所)が運転を開始した。

2025年までに1GWの再生可能エネルギー導入

 米陸軍機関は2025年までに1GWの再生可能エネルギーを導入する目標を掲げており、今回のメガソーラーはその実現に向けた取り組みの一つである。
 目標達成のため、陸軍エネルギーイニシアチブオフィス(the Office of Energy Initiatives、以下OEI)は、民間出資による10MW以上の大規模な再エネプロジェクトを開発して遂行、そして監督する。
 エネルギー確保と、その安全保障の強化は、陸軍本来のミッションを達成する能力と効率を高めるために欠かせない要素となる。そのため再エネは、陸軍のエネルギー安全保障戦略において重要な位置付けにある。OEIが現在、開発中の大規模な再エネプロジェクトは、すでに「1GWゴール」の30%以上を占める(図2)。
図2●米陸軍のメガソーラー導入状況。
緑色=運営中のメガソーラー、黄緑色=建設中、
黄色=契約・同意、青色=評価中、そして、灰色=高潜在度プロジェクトを示す
(出所:the Army Office of Energy Initiatives)
民間企業が基地内のメガソーラーを所有し運営も担う

 現在、陸軍基地に導入されているメガソーラーは、アリゾナ州フォートフアチュカ (Fort Huachuca) 基地内にある。地元の電力会社Tucson Electric Power(TEP)社が開発・運営する連系出力18MWの発電設備で、2014年の12月に完成した。メガソーラーはこの基地の約25%の電力需要を賄っている。陸軍はTEP社と30年間の電力購入契約を結んでいる。
 フォートベニング基地に竣工したばかりの連系出力30MW(パネル容量42MW)のメガソーラー、さらに同じジョージア州に建設中の2カ所の連系出力30MWのメガソーラー(フォートゴードンとフォートスチュアート)も、陸軍基地内に設置する。...Read More Here

May 30, 2016

米大手電力、世界最大のデータセンター向けに「100%再エネ」プラン 環境目標を掲げる大規模需要家の“離脱”を阻止

Published at Nikkei Technology Online --- ネバダ州と言えば、広大な自然からなるグランドキャニオンとカジノの「眠らない街」ラスベガスの2つの観光スポットで有名である。そんなネバタ州をサービス管轄にする大手電力会社NV Energy社が、「100%再生可能エネルギー」電力プランの提供を開始した。背景には、地球温暖化対策と持続可能な社会の構築を目標に掲げる大規模電力需要家に対し、二酸化炭素の削減目標をサポートする狙いがある。


 家具世界大手のイケアを始め、ナイキ、グーグル、ジョンソン・エンド・ジョンソン、スターバックス、ウォルマートなど、世界的なリーディングカンパニーは地球温暖化対策の1つとし、全ての事業所で使用する電力を100%再生可能エネルギーで賄うことを目標と掲げている。これらの企業は目標を達成するために、屋根置き太陽光発電などの分散型発電をオフィス、または工場などに設置したり、メガソーラー(大規模太陽光発電所)のディベロッパーと長期電力購入契約を結んだりするケースがある。
 米国ネバダ州ラスベガスに拠点を持つSwitch社も例外ではない。同社はSUPERNAPと呼ばれるデータセンターの開発・運営とコロケーションなどのサービスも提供している。膨大な電力を使用し、1000以上のクライアントのミッションクリティカルなビジネスをサポートする。
ネバタ州レノに計画中のSwitch社のSUPERNAPデータセンター(出所:Switch社)

データセンターの電気を再エネ100%に
 同社は現在、ラスベガスで9つのデータセンターキャンパスを運営しており、総面積151万926平方フィートになる。さらに3つのデータセンターを建設している(総面積119万8348平方フィート)。また、ネバタ州北部に位置するレノではデータセンターキャンパスを建設中(総面積120万947平方フィート)で、さらに6つのデータセンターキャンパス(総面積528万6294平方フィート)の建設を予定している。
 レノのデータセンターが完成すると、世界最大のデータセンターになる(図2)。ちなみに、出品・販売・輸出できるオンラインマーケットプレイスを提供する米EBay社はレノのデータセンターの新顧客である。..Read More Here

April 12, 2016

「第3者所有モデル」で急成長した米ソーラーシティ社 「太陽光発電を無料で設置!」は日本で成功するか?

Published at Nikkei Technology Online ---  日本で太陽光発電のリーディングカンパニーである日本エコシステムがついに「あのサービス」を立ち上げた。「あの」とは、太陽光発電を手持ち資金なしで設置でき、自分の屋根で発電した電気を自分で使える電力小売りモデルである。

 「じぶん電力」と名付けたこの新サービスは、米国で2008年から急速に普及し始めた「第三者所有(Third-Party Ownership:TPO)モデル」の仕組みとほぼ同じである。

 米国には、自宅に太陽光発電設備を設置して、電気料金を削減し、地球温暖化防止に貢献したいと思うものの、システムの高額な導入費と長期間に渡るシステムメインテナンスを考えると一歩踏み出せない、という電力消費者が多い。そんな消費者の要望に応えるように、太陽光発電を手軽に活用できる方法として、TPOモデルが登場した。

ニューヨーク州での「TPOモデル」浸透率は90%

 従来は、インストーラーがシステムを販売して設置し、電力消費者がシステムを(現金、またはローンで)購入、所有していた。TPOモデルの場合、デベロッパーが第三者から資金を調達して電力消費者の自宅の屋根に太陽光発電を設置し、さらに、システムから発電される電力を消費者に販売するものだ。

 消費者は大きな導入費無し、修理・メインテナンスに煩わされずに、太陽光発電の恩恵を享受できる。このモデルはシステムのリースと違い、電力売買を伴うので、電力購入契約(Power Purchase Agreement:PPA)とつなげて、TPOPPAと呼ばれることもある。

Residential PV TPO Penetration Rates by Key States, Credit: NREL

 「導入費なし」が受け、TPOはオーナー所有(現金、ローン購入)をぐんぐん抜き、2014年には米国住宅用太陽光発電市場のなんと72%を占めるまでに成長した。その設置容量は890MWに達する。TPOの貢献は大きく、米国住宅用太陽光発電市場は過去4年連続で50%の成長率を続け、2014年から非住宅用(産業・商業)市場規模を上回るまでになった。Read More Here

January 12, 2016

米加州の「ネットメータリング」制度が改正へ 再エネの普及拡大と消費者の負担、バランスはどこに?

Published at Nikkei Technology Online --- 米国市場は2015年の年末ぎりぎりに連邦政府の「再生可能エネルギー導入投資税控除(ITC)」政策延長が可決され、さらなる太陽光発電市場の成長に明るい見通しが立った。しかし、米国の太陽光発電市場をリードするカリフォルニア州において、同州の太陽光発電市場の将来を左右する重要な州レベルの制度が未解決のまま年を超えた。

 それは同州で分散型太陽光発電分野の普及を支えてきた「ネットメータリング(net-metering)」と呼ばれる制度である。「ネットメータリング」とは、分散型発電設備の所有者に対する電力料金の算定手法だ。住宅用などの分散型太陽光発電システムの発電量から、電力消費量を差し引いて余剰電力量が発生した場合、余剰分を次の月に繰り越せる、つまり、消費量を発電量で「相殺」する仕組みである(図1)。

図1●ネットメータリング制度を利用する住宅用システム。出力7.6kW(出所:Sullivan Solar Power)
この制度では、ネットメータリングの総設置容量に関し、法律で上限を定めている。上限は、「キャップ(CAP)」とも呼ばれる。ネットメータリングを活用する分散型太陽光発電システムの総設置容量が、キャップに達すると、電力会社は同システムの設置を基本的に拒否できるようになる。カリフォルニア州ではこの上限に近づいており、2015年に電力会社と太陽光発電を推進する企業やサポーター(支持者)間で同制度をめぐる論争が一段と激しくなった。

 現在のネットメータリング制度は、発電量1kWhは電力購入の小売価格と同等で取り扱われていたが、カリフォルニア州の大手電力会社は「余剰電力買い上げ価格を下げる」、または「太陽光発電システムの所有者に特別の料金を課す」との方針を申請した。...Read More Here

October 21, 2015

再エネ電力を電力会社より安く販売できる「CCA制度」(前半) 地方自治体が太陽光や風力をまとめ買いして消費者に提供

Published at Nikkei Technology ---  米カリフォルニア州では、2000~2001年に発生した電力危機が原因で小売全面自由化が保留になってしまった。民間電力会社の地域独占が継続され、家庭用電力消費者は電力購入の「チョイス(選択)」の機会を失った。

 にもかかわらず、同州北部マリーン郡とその周辺の消費者は、電力の購入先を大手電力会社から地方自治体に乗り換え、環境に優しい再生可能エネルギーを選ぶことができる。乗り換えにより、今年は1060万ドル(約12.6億円)の電気料金と、6万t以上の温室効果ガス削減が見込まれている。

 こうした「乗り換え」を可能にしているのが、コミュニティー・チョイス・アグリゲーション(Community Choice Aggregation: CCA)と呼ばれる法律だ。同法は、地方自治体などが住民、ビジネス、さらに公共施設用の電力需要をまとめて購入できることを規定したもので、2002年に成立した。この法律により、地方自治体は、自ら電力を発電、または発電事業者から電力を調達し、コミュニティーに「チョイス」を提供できるようになった。

How CCA Works; Credit: MCE


顧客は17万5000軒を超える

 カリフォルニア州北部に位置するマリーン郡は、州で最初にCCA制度を導入した地方自治体である。マリーン・クリーン・エネルギー(Marin Clean Energy:MCE)というNPO法人が2008年に設立され、2010年からコミュニティーの電力需要をまとめ、電力を調達し始めた。

 「マリーン郡では、地球温暖化防止対策として建物部門からのCO2排出削減に取り組んでいます。電力消費によるCO2 排出量の抑制策として、再生可能エネルギーの導入を拡大できるCCAに着目しました」と、MCEでCEO(最高経営責任者)を務めるDawn Weisz氏は同機関の創設までの経緯について語った。...Read More Here

September 18, 2015

バイデン米副大統領が演説、「太陽光発電は可能性に満ち、大きな転換期に向かっている」

Published at Nikkei Technology ---  9月16日、米国カリフォルニア州アナハイム市で行われた北米最大の太陽光発電関連展示会「Solar Power International」で、ジョー・バイデン米副大統領が約4000人を前に演説を行った。

Vice President Joe Biden at Solar Power International 2015, Credit: Steven Purcell for SPI 2015


 「たくさんの米国人が太陽光発電の『可能性』を理解し始めました。今後も幾何級数的に増えるでしょう。太陽光発電でさらに何ができるかを想像してみてください。どんなにより良い雇用を創出できるか。どんなに心臓病や喘息で患う人を救えるか。どれだけ税金負担を減らせるか。私たちはとても大きな転換期にいます」と、同副大統領は産業の雇用創出と気候変動防止への大きな貢献を称えた。

 「オバマ大統領と私が政権についてから、太陽光発電は20倍に拡大し、さらに雇用は17万4000人から86%増え、今年の終わりには21万人の雇用と予想されています。太陽光発電システムの設置数は2009年の2万件から今年末には100万件に達すると言われています」。...Read More Here

July 31, 2015

World Moves Toward 100 Percent Renewable Energy – First Electricity, Then Heating/Cooling, and Finally Transportation

Published at Renewable Energy World --- The exclusive use of energy from renewable resources in at least one sector has now become a feasible goal for 8 countries. Diane Moss, Founding Director of Renewables 100 Policy Institute, discussed this remarkable development at one of the conference sessions at Intersolar North America 2015.

Denmark, Scotland, and Aruba are among the nations with 100 percent renewable energy targets.  Besides the 8 nations, the Institute has so far mapped 55 cities, 60 regions and 9 utilities across the world that have officially established 100 percent RE goals, and Moss points out that there may be more and that those numbers are steadily increasing.

RE100 percent Around the World, Credit: Renewables 100 Policy Institute
Recent advancements in renewable technologies and rapid cost reductions have accelerated deployment of renewable energy, such as wind and solar photovoltaics (PV).  Renewables have started becoming a mainstream energy source in many parts of the world.

According to the Global Status Report published by REN21, a Paris-based nonprofit group, the growth of renewable energy outpaced that of fossil fuels in the electricity sector in 2014, with a record 135 gigawatts (GW) of capacity added from wind, solar, hydropower, and other natural sources.

Renewable energy developments have been driven largely by government policies, which include the RE targets of cities, states, regions, and countries. Some governments or communities are driven to deploy more renewables to reduce dependency on imported fossil fuels (energy security), tackle climate change (environment), and/or stimulate local jobs (economy)....Read More Here

July 11, 2015

Japan's Long-term Energy Plan Shoots for Ultimate Balance in Economics, Environment and Safety

Published at Renewable Energy World --- What is 3E + S? It is neither a mathematics problem nor chemical equation. It is Japan’s latest long-term energy plan, which was released by Japan's Ministry of Economy, Trade and Industry (METI) on June 1stf for review. The draft plan aims to establish an optimum energy mix by the year 2030.

The three Es stand for the first letters in Energy Security, Economic Efficiency and Environment and the letter S stands for Safety. Safety is crucial to the energy plan in the wake of the world’s worst nuclear disaster since Chernobyl when the devastating tsunami and earthquake hit northeast Japan in 2011. Since the disasters, Japan’s electricity generation mix has drastically changed.
The fear of nuclear power plants led to the shutting down of 54 of the nation’s nuclear reactors, which used to provide about 30 percent of the nation electricity. To make up for the loss of electricity supplied by nuclear means, Japan turned its heads toward coal and Liquefied Natural Gas (LNG). The nation’s sharp increase in fossil fuel demand caused the price of LNG, linked to crude oil import price, to soar.


The transition from nuclear to fossil fuels caused the nation’s energy self-sufficiency percentage to plummet to a mere 6 percent and Japan’s greenhouse gasses to hit an alarming record high in 2013. The increase cost of fossil fuel imports and the nationwide feed-in tariff (FIT) program has also increased electricity prices by 30 percent for industry users and 20 percent for residential consumers.
New Plan to Reverse the Effect of Fossil Fuels
The 3E + S plan aims to reverse the effects brought by the increased consumption of fossil fuels. Japan specifically wants to improve its self-sufficiency to 25 percent above the pre-disaster level. It also hopes to control and reduce electricity cost for the nation’s industry to gain back a competitive advantage while reducing greenhouse gas emissions to the same level as the Western nations.Read More Here

May 19, 2015

Born from Disaster: Japan Establishes First Microgrid Community

Published at Renewable Energy World --- Following the 2011 earthquake, tsunami and nuclear disaster in Japan, one city decided to transition to a clean, renewable future and became Japan's first microgrid community.

Although Japan's Fukushima prefecture is most commonly associated with the 2011 disaster due to the nuclear power melt-down, Miyazaki prefecture, located north of Fukushima, suffered the largest death toll, close to 10,000, and the largest flood damage in the nation.

Located on the coast, Higashimatsushima city was no exception. It had a catastrophic tsunami-caused flood, which put 65 percent of the city under water, with over 1,100 lives lost. Approximately 10,000 residents lost their homes and were forced to evacuate.


“After the disaster, some parts of the town didn’t get electricity for up to three months,” said Tohoru Ishigaki at the office of Future City Initiative under the city’s Department of Disaster Recovery Policy. “We strongly felt [after the disaster] that our responsibility was to provide reliable energy.”
Turn Local Tragedy Into a New and Vibrant Vision

To create a safe, resilient and sustainable society for the remaining population of 40,000, the city decided to deploy distributed, clean renewable energy sources. Under post-disaster recovery and reconstruction plans, the city set a bold goal to become a Net Zero Energy City by 2022, supplying the entire city with locally produced energy.

As a first step, the city turned a flood-affected former city park into a 2-MW solar photovoltaic (PV) project. This project symbolizes the city’s commitment to energy self-sufficiency. Mitsui & Co., Ltd, one of the largest trading company in Japan, completed this system in the summer 2013. The company also built PV carport systems with a total capacity of 270 kW at three locations on high ground, away from the vulnerable coastline. These sites are designated for evacuations and solar power will provide emergency power....Read More Here


April 20, 2015

Japan Solar Boom Spurred by Low-Interest Loans from Local Banks, Credit Unions, Utilities

Published at Renewable Energy World --- San Diego, Calif. — The U.S. residential solar photovoltaic (PV) market is on the rise. According to SEIA/GTM Research, in 2014 the residential market surpassed the non-residential market for the first time. "The past three years have now seen the residential market grow by at least 50 percent on an annual basis, buoyed by major strides to lower soft costs, in tandem with increased penetration of third party financing solutions,” commented Cory Honeyman, Solar Analyst at GTM Research.

While the third-party ownership (TPO) financing option has been the strong driver for the last several years, solar loans, which provide ownerships to homeowners, are now moving into the mainstream.

Japan, which installed almost twice as many residential PV installations as the U.S. in 2014, is one of the world's largest residential PV markets in terms of cumulative installations. The country’s residential PV market has achieved this with only two PV financing options: cash and loans. It has not offered leasing or power purchase agreements, which are common in the U.S.

“About forty percent of our customers buy PV systems with cash and the remaining 60 percent of our customers use solar loans,” said a manager of one of the largest residential PV installers in Japan.

According to the manager, the average purchase cost of a system (3-4 kW-DC) the company sells is approximately ¥1.5 million ($12,600), and for those who don’t have bundles of cash stashed away in the home, the company offers solar loans through three consumer credit financing companies.  All three of them offer 10- or 15-year unsecured loans with low, fixed interest rates....Read More Here

March 19, 2015

Post-FIT Japan: Manufacturers Promote PV Systems with Inverter-Integrated Energy Storage Systems

Published at Renewable Energy World --- The Japanese government has announced the new feed-in tariff (FIT) rate for the fiscal year 2015, effective April 1st. The new FIT rate for residential solar photovoltaic (PV) systems will be ¥33/kWh, down from ¥37/kWh the previous fiscal year.

January 5, 2015

太陽電池の接続トラブルを系統の「見える化」で解決 (Grid Issue with Deploying Large Capacity of PV)

Published at Nikkei Electronics --- 日本では再生可能エネルギーの導入量が急増したことで、一部の電力会社が接続申し込みの回答を保留する事態となった。実は米国でも、同様の問題が発生していることを、ご存じだろうか。日本人の旅行先として人気が高いハワイ州で、接続の保留や電力の逆潮流が発生している。... Get Magazine Here

Nikkei Electronics January 5 2015 Issue

Daily Electricity Load in Hawaii - Elephant Shape; Source: HECO


October 1, 2014

相次ぐスマートメーターの設置拒否、既存メーターの継続利用に特別料金を徴収へ

Published at Nikkei Business ---  日本では電力自由化に向けて、スマートメーターの設置が本格化していると聞く。ところが米国では、至る所でスマートメーターの導入に「待った」がかかっている。サービス向上とコスト削減に貢献すると言われるスマートメーター。なぜ導入を拒否する事例が後を絶たないのか。

 スマートメーターは、双方向通信機能を備えた電力消費量を測定するシステムである。従来のアナログメーターとの大きな違いは、測定した電力消費量をリアルタイムで無線送信できることや、電力会社がリモートでサービスの接続・切断などができること、さらに電力供給量を制御できることなどである。

 ワシントンDCに拠点を置くIEE (Innovation Electricity Efficiency)研究所が、2013年8月に発表したレポートによると、2013年7月時点で4600万台以上のスマートメーターが、全米に設置済みという。これは全米の電力契約数の約32%に当たる。

 米国連邦政府は「米国再生・再投資法(America Recovery and Reinvestment Act)」に基づき、「スマートグリッド投資補助金(Smart Grid Investment Grant:SGIG)」を創設して、スマートメーターに対する開発支援を積極的に行っている。Read More Here